Insightful Financial and Management Reporting & Analysis
Reporting with Planful provides a robust library of reporting formats and delivery options, enabling finance and business users to produce a wide range of interactive financial and management reports leveraging one source of truth.
Key Advantages


Key Features
Create highly formatted reports and board books
Customize the look and feel of your reports to visually present data in the way that is most meaningful to your organization. Advanced formatting capabilities include: font types, font size, font color, additional border types and colors, header formatting, granular data formatting including variance traffic lighting, and many more.
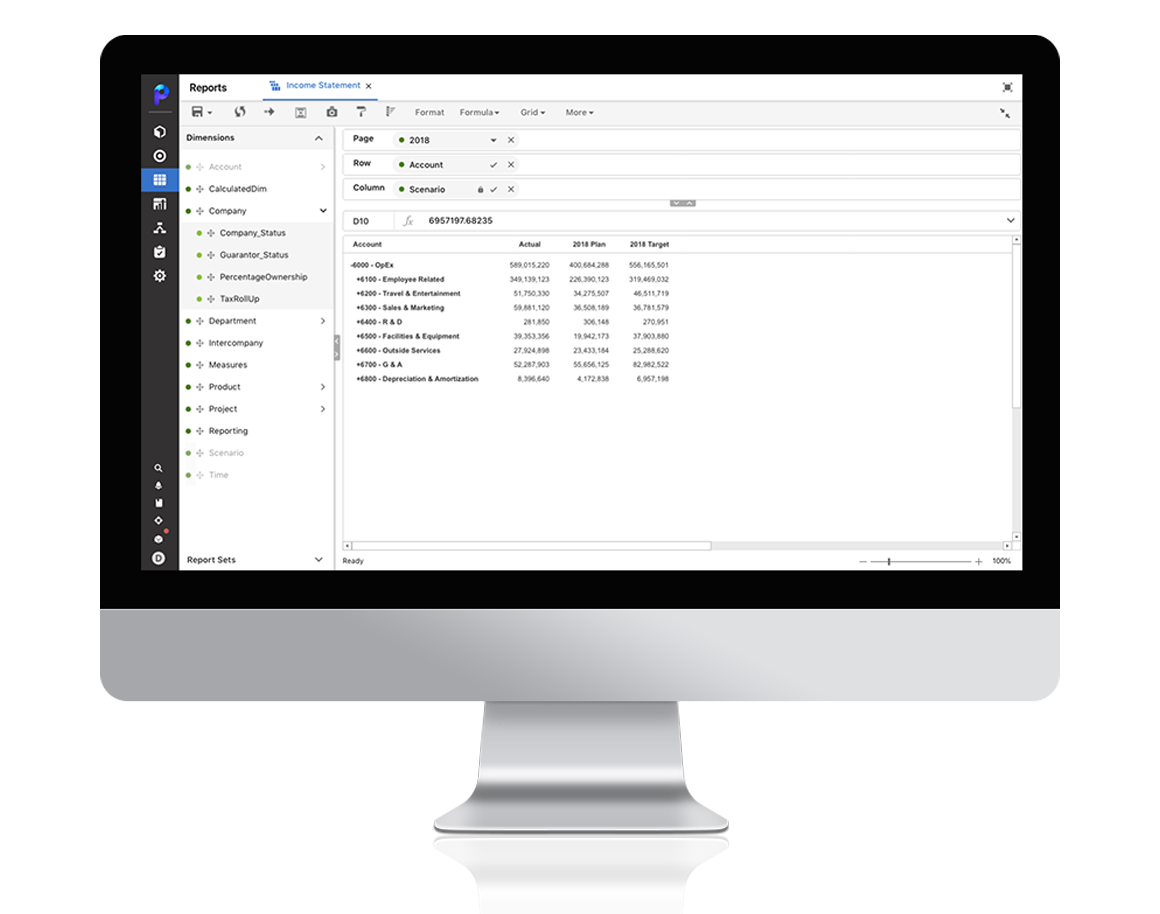
Flexible ad-hoc reporting
Generate ad-hoc financial and management reports from a single reporting tool. Point-and-click to drill into the data to answer tough questions as they arise.
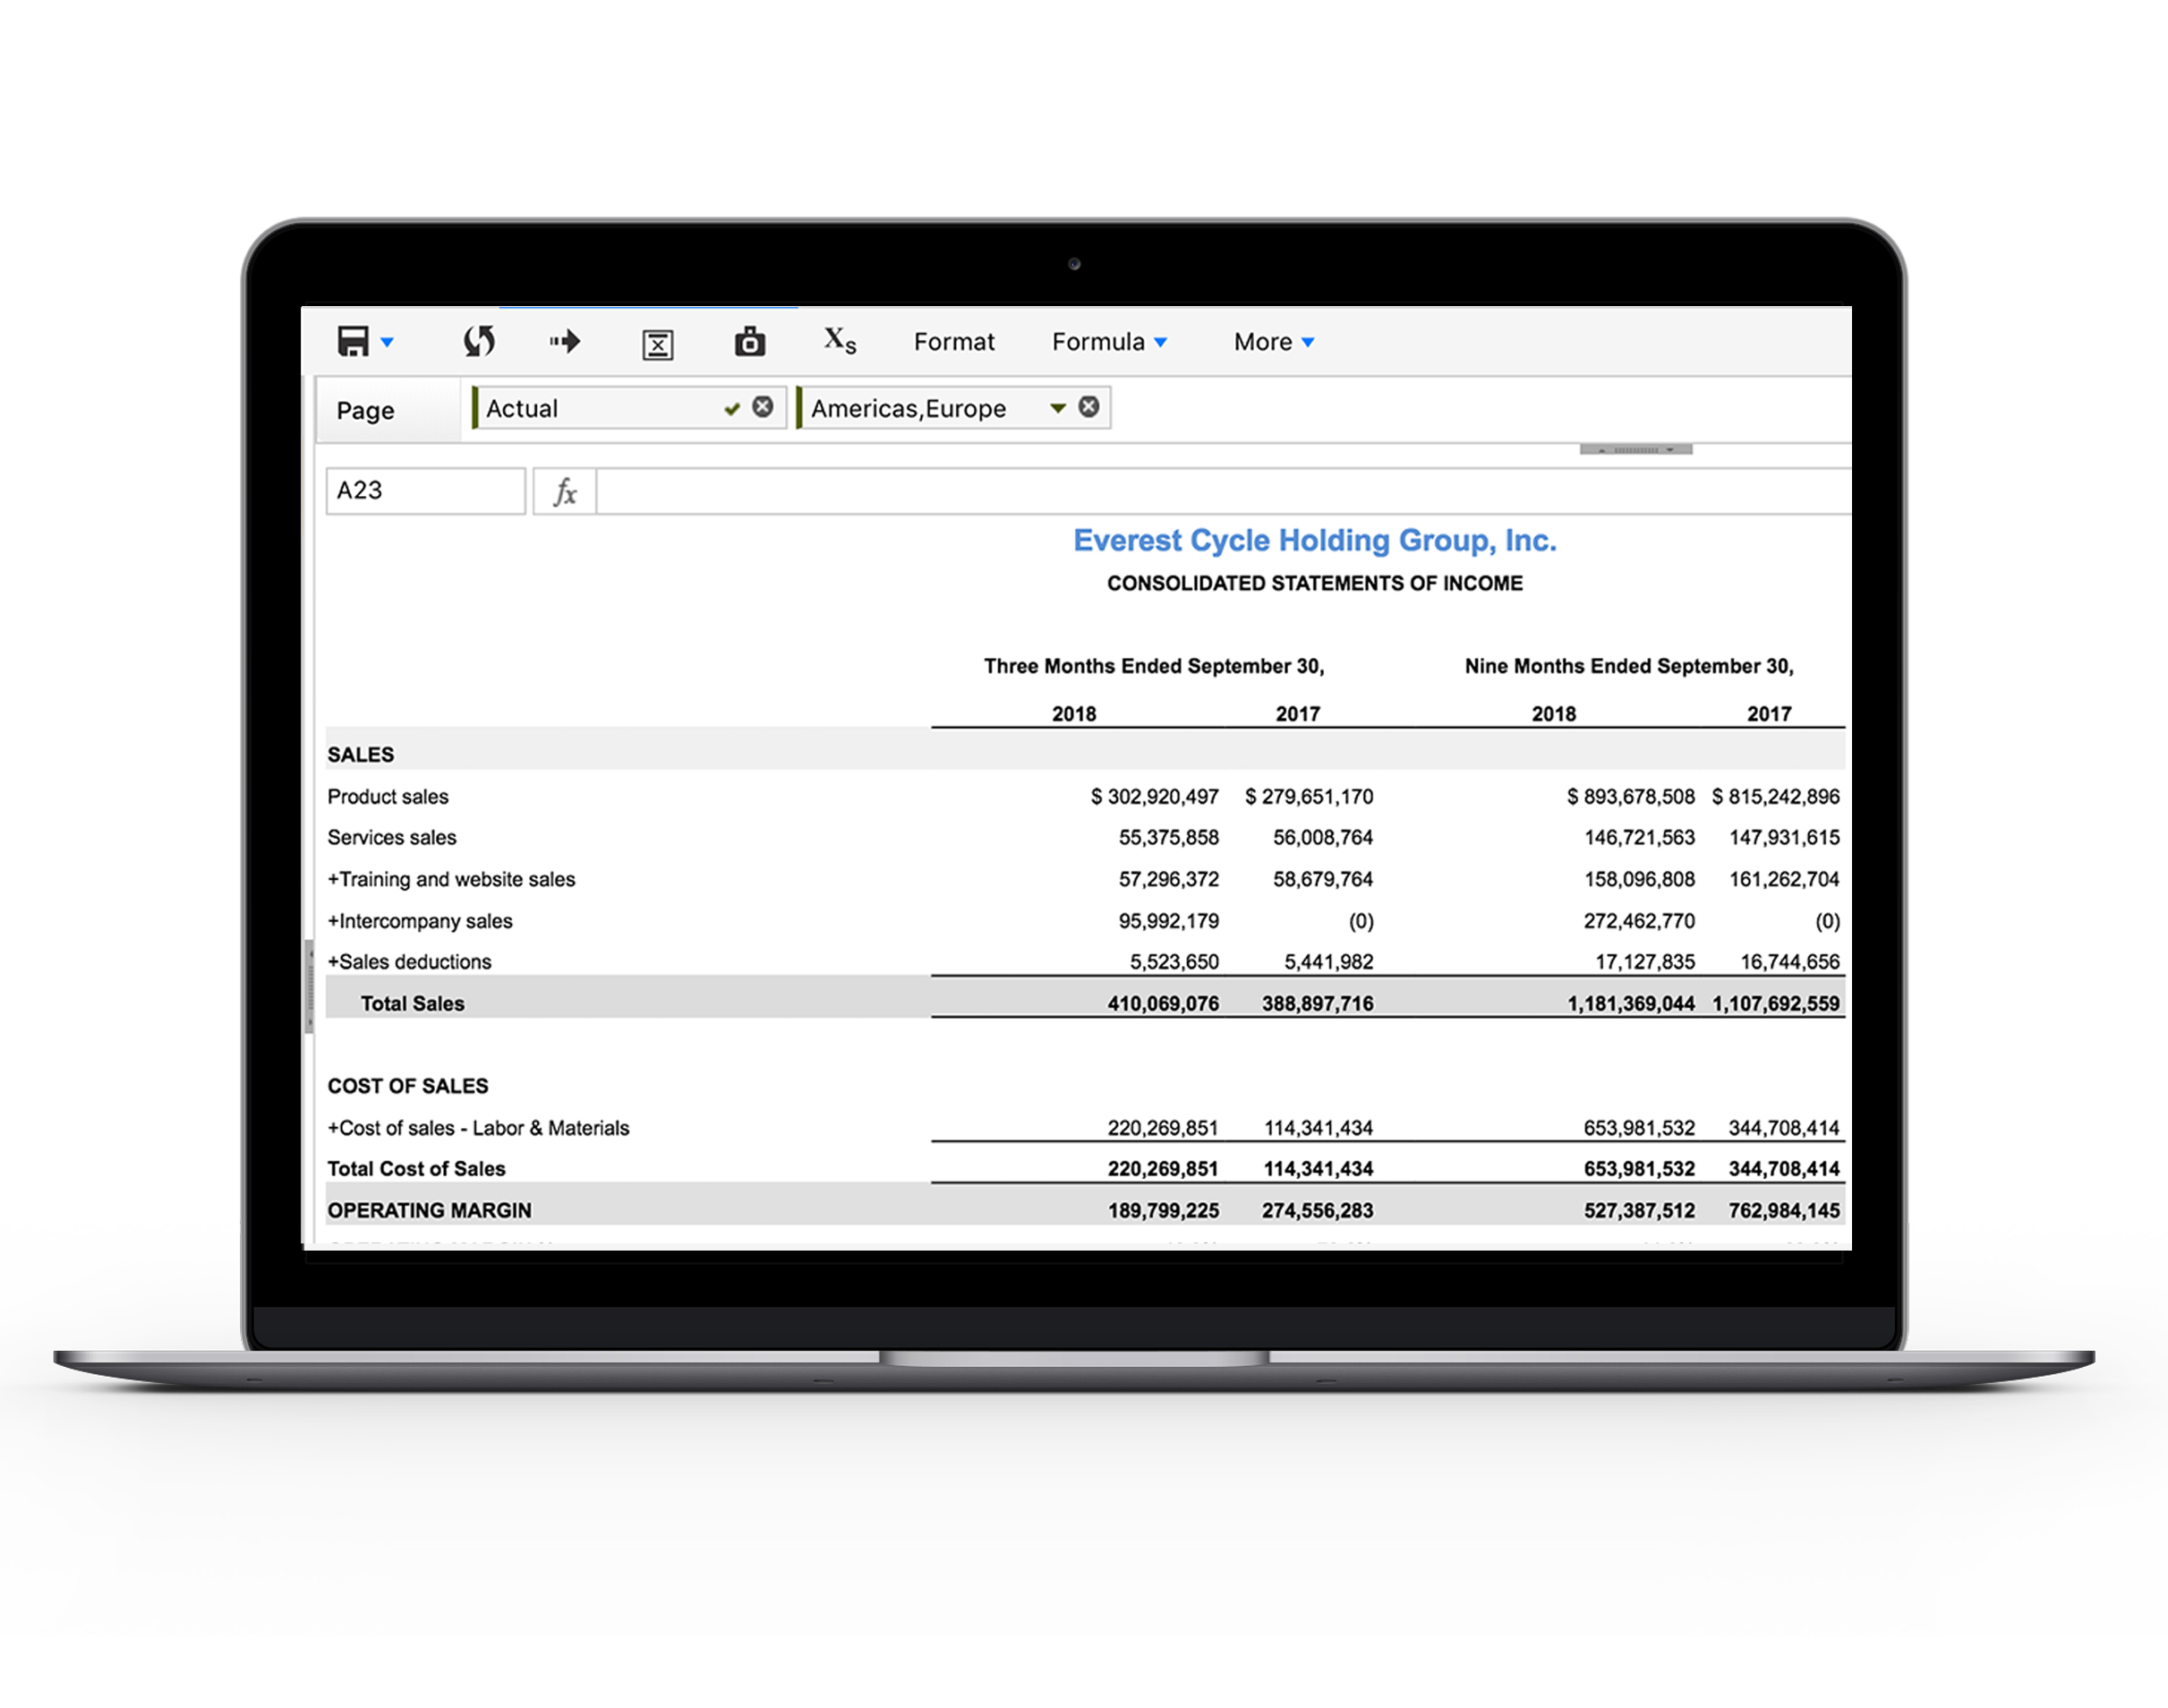
Spotlight Reporting
Harness the full power of Excel for information presentation while ensuring “one version of the truth” from a centralized, secure data store. Once a report is created in Excel it can be accessed anywhere—Excel, web or mobile interface. Spotlight delivers data security, data integrity, and full audit trail by relying on the Planful platform as its foundation and the single source of truth.
Automated management and financial reporting
Take the hassle out of publishing the final board book or presentation while reducing the risk of typos and missed data. Combine source documents and Planful data—financial and operating results, data, graphs, and narratives—to create a single PowerPoint or Word document.

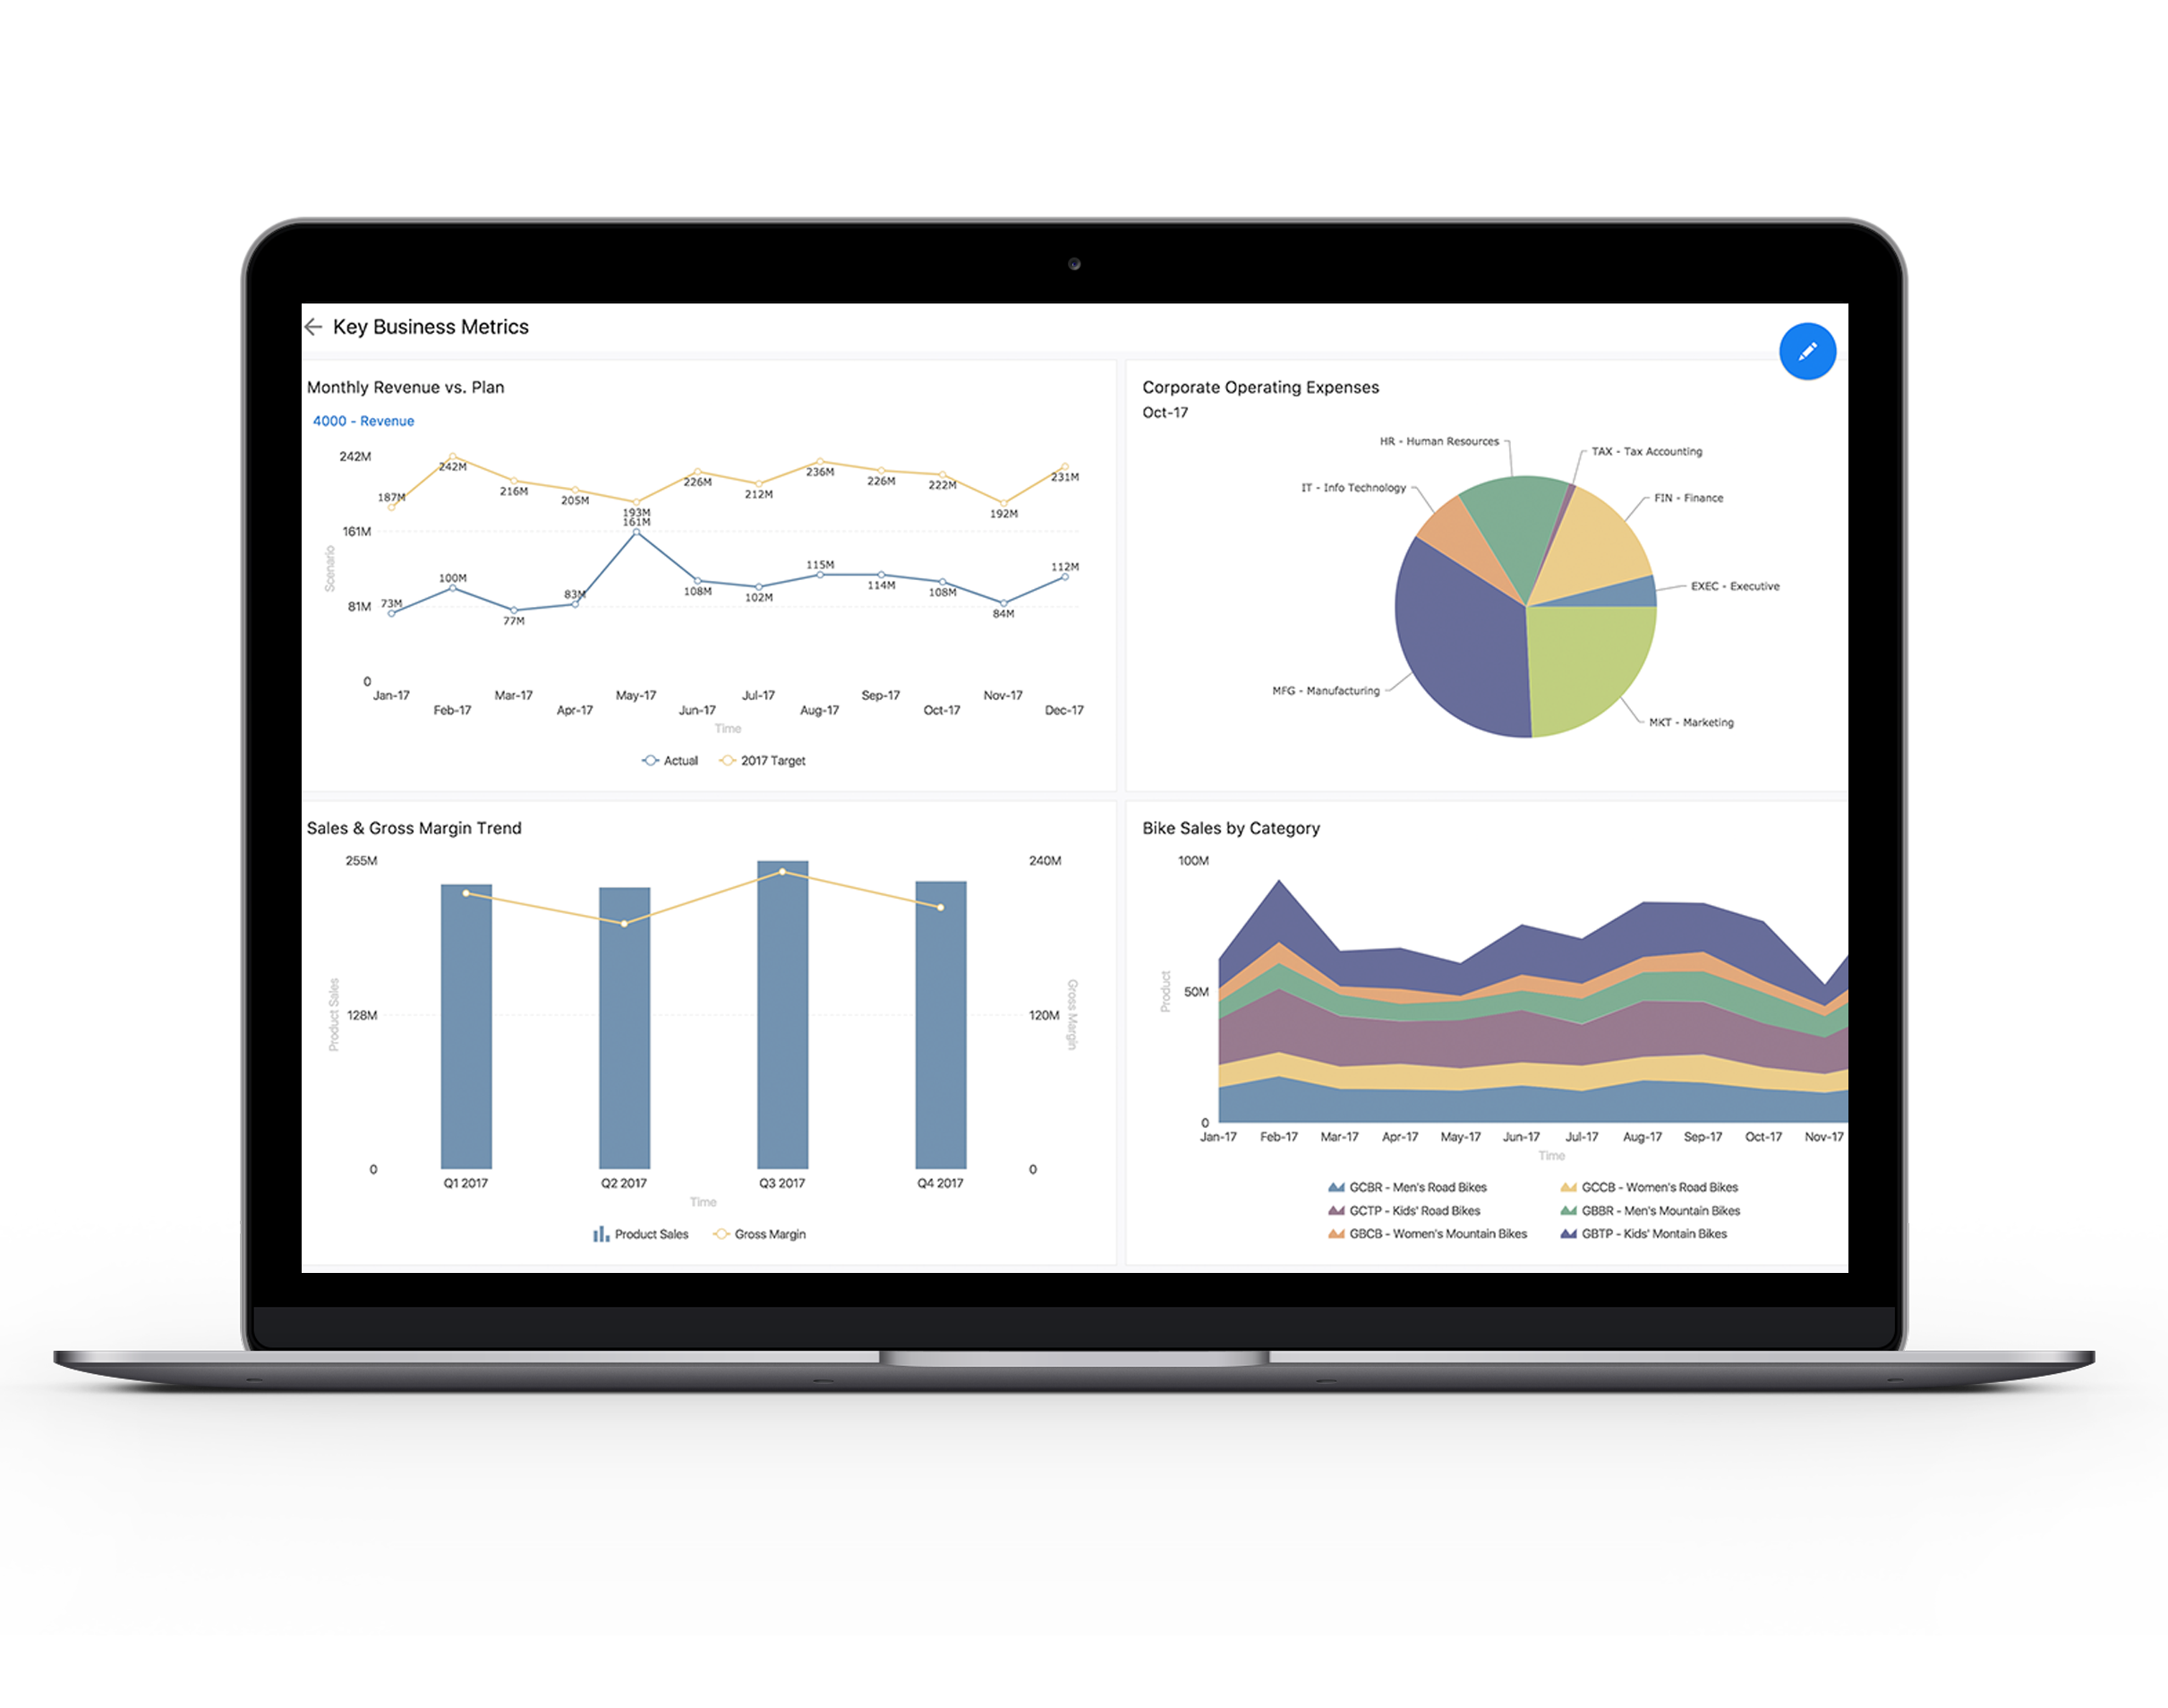
Self-service dashboards
Finance, as well as budget owners, can easily create, customize, and share dashboards using a simple, intuitive, drag-and-drop interface. There is no need for any coding or training.
Cloud access and flexible delivery options
Present reports the way you and your stakeholders want it, whether online, PDF, or in Excel. Select the format that works best for you, and pull all financial and operational data directly from Planful. Any finance team member or budget owner can review existing reports or create new ones without IT assistance.

Additional Features
Query, analysis with Spotlight
Perform ad-hoc, multidimensional analysis with Spotlight in Excel or web. Zoom in/out, keep, remove, and pivot on all your categories and segments to explore data at the most granular level and see aggregated financial results for the whole business.

Spotlight Reporting
Harness the full power of Excel for information presentation while ensuring “one version of the truth” from a centralized, secure data store. Once a report is created in Excel it can be accessed anywhere—Excel, web or mobile interface.
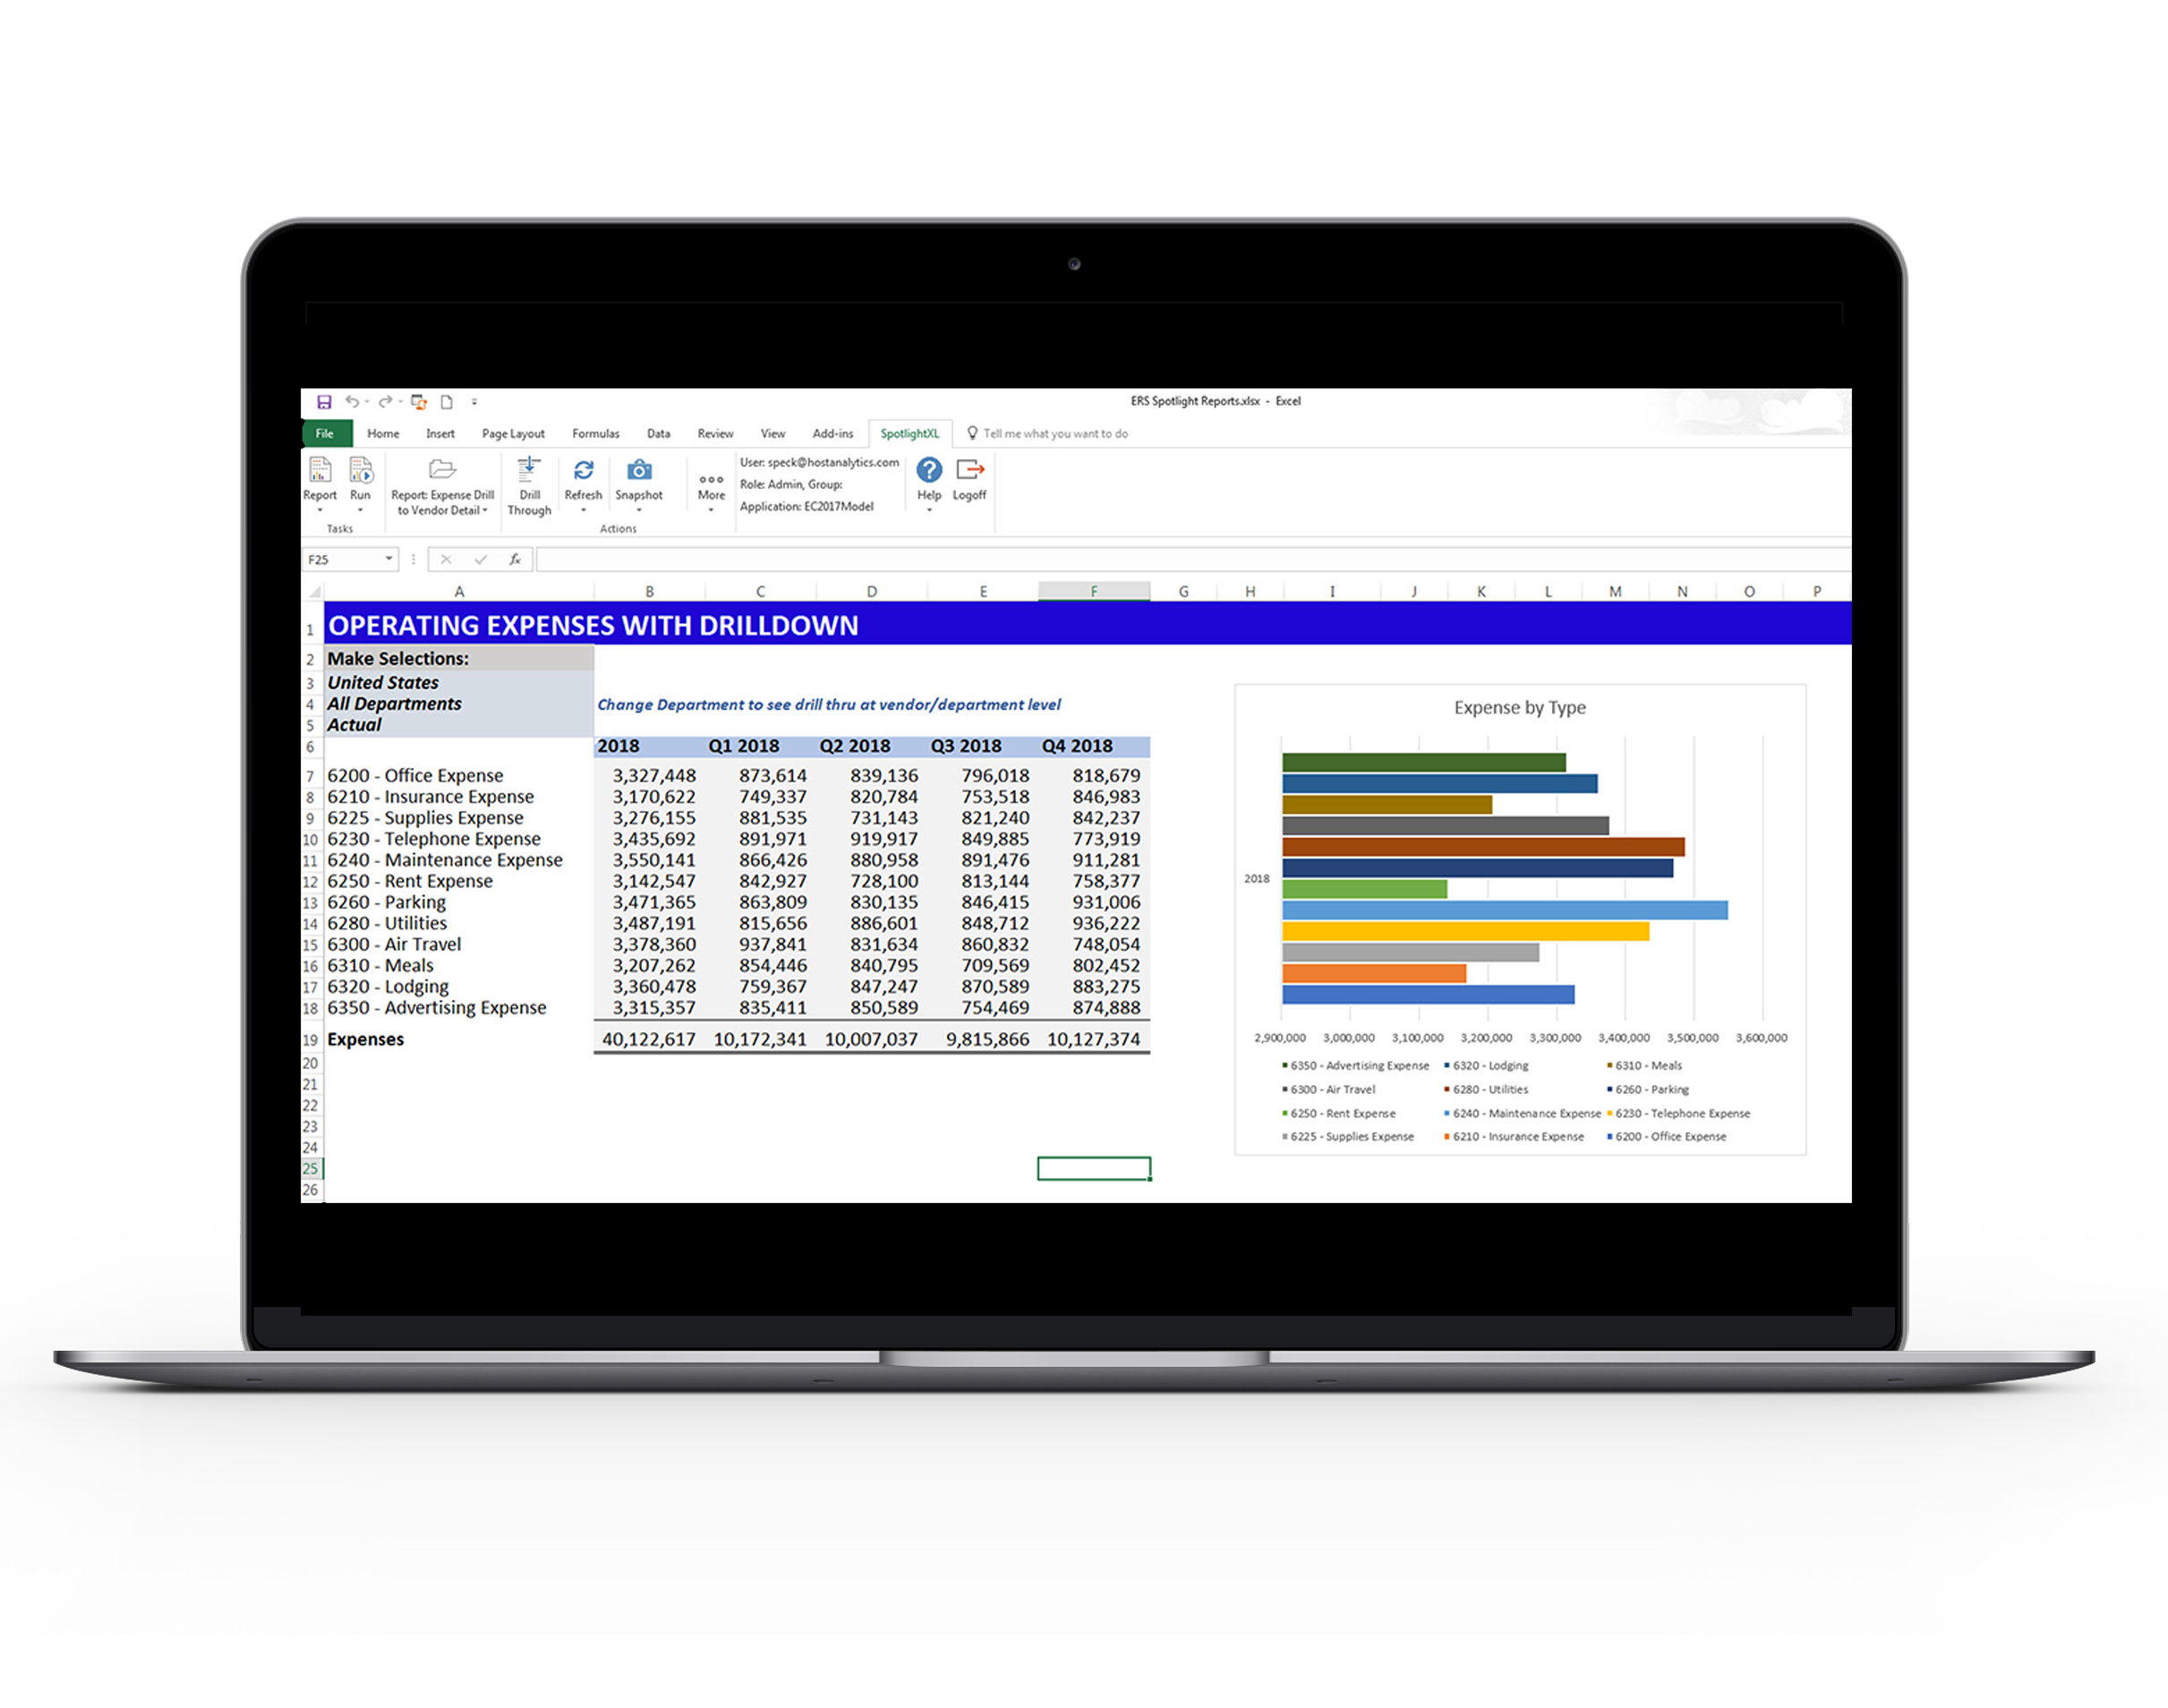
Spotlight for Office
Seamlessly build management and financial reports and presentations directly within Microsoft Excel, Word, and PowerPoint. With the push of a button, data can be dynamically refreshed within the Office applications; ensuring data is always accurate and up to date.
Bringing in operational metrics enables us to spot things we couldn’t have seen before so that the financials make a lot more sense for our operational managers.

Best Practices in Financial Reporting
Four best practices in financial reporting to allow FP&A teams to focus on higher-impact work to optimize future results.
Complete Guide to Modernizing Your Financial Processes
Outdated processes and legacy technologies hinder planning, budgeting, and forecasting. This guide demonstrates the pains and challenges of budgeting and provides tips for solving those issues with a successful FP&A platform.
Leverage Dynamic Planning to Accelerate Your Close
Representatives from ProMach and KeenVision share creative ways clients are using dynamic planning.

